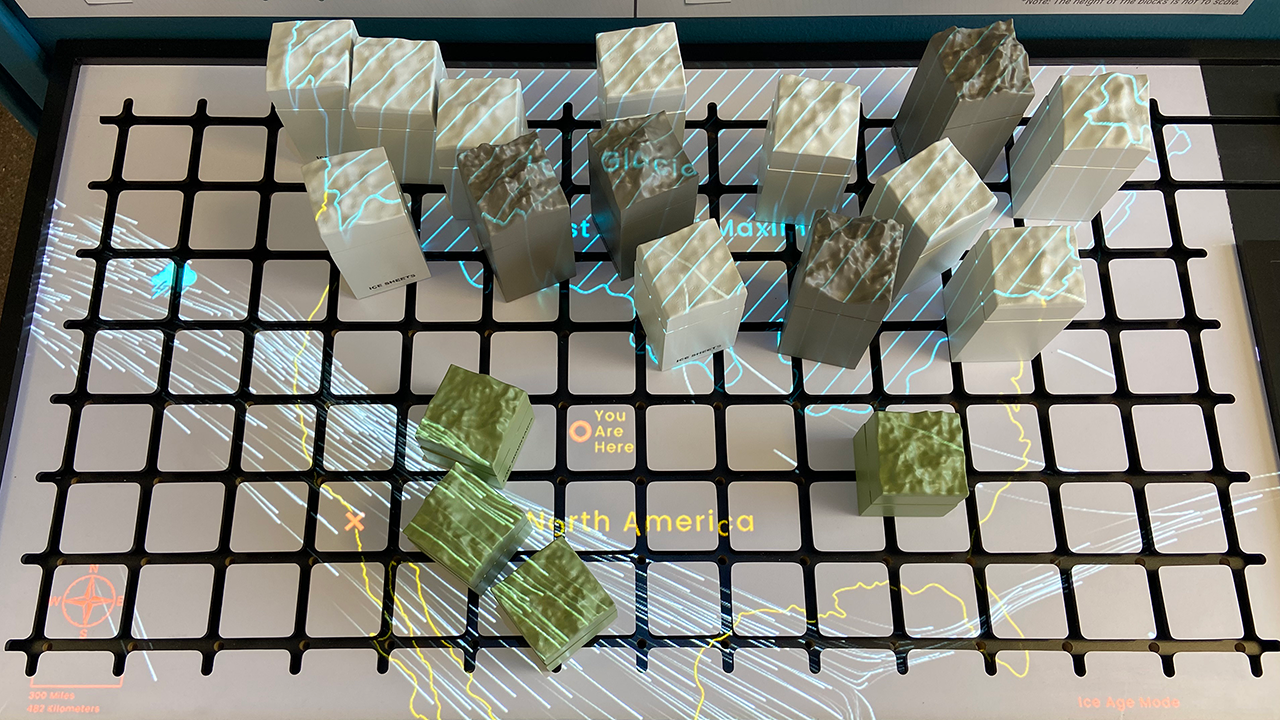
Hi, I am a designer, coder, educator and now PhD student at ATLAS, University of Colorado at Boulder. I have 15 years professional experience as a designer and educator. My research interests lie in creating novel tools and experiences of situated data. I am currently exploring Machine Learning for sensing, Tangible User Interfaces and Augmented Reality with wildlife data and climate simulation, and Digital Twins.

Needlmovers Globe

Interactive Map

This interactive globe allows a user to search for a location such as a city or neighbourhood and find relevant environment data files, suggested and ranked based on proximity to search point, similarity of elevation and latitude. Data points can be colored by different data metrics and filtered by elevation. You can try it yourself here. This globe is a fully functional concept prototype that fits into a larger piece on the Needlemovers project; software to help urban designers, planners, and architects design for thermal comfort with the most relevant data at hand. Created for Sasaki, while interning there during summer 2023.

Trip Viewer

Interactive Map

A 3D interactive map visualisation showing the trips made across campus on a typically busy day at U Mich. Trips can be filtered by what major a student is taking, the type of class being taken or which campus is the trip destination. The purpose of the visualisation was to help communicate and interrogate journeys made by different student groups, what kind of student experience that might be, and what provisions can be implemented to improve student trips in the future. Created while interning at Sasaki, in summer 2023.

Telepresent Nature

TUI to Wildlife Data

Currently in development, a Tangible User Interface using small TOIO Robots to represent and interface with wildlife data. One robot represents a Deer whose location was tracked over a year and the other robots are used to interrogate a timeline and control the map. The purpose of the interface is to bring a sense of presence to working with remote tracking data; to make the data alive in your space. There is an Augmented Reality data overlay to display further data stacked ontop of the animal robot and to display interaction state. Applications could include in the labs of movement ecologists, visitor experiences for national park and wilderness management, or in education to demonstrate migration routes and patterns of animals.

Project WILD

Research Proposal

This is a research proposal for a community created Digital Twin that enables community members to interact with wildlife and environment data with Augmented Reality and Tangible User Interfaces. Sensors would be deployed across the community and AR/TUI interfaces co-designed with the community. The whole process would be documented to create a toolkit for similar projects to be initiated and implemented following best practices. This project taps into emerging areas of research in Immersive Analytics and Digital Twins, leveraging the power of Co-Design to engage with nature. I am actively pursuing collaborators and funders for this project. Vision video coming soon...

White Mountain, Green Mountain

Interactive Science Demonstrator

In the last Ice Age the climate of the US Southwest was much wetter than it is today. This is due to both the massive ice sheets forcing wind south and changing the climate through the ice sheet albedo effect. This tabletop Tangible User Interface allows users to build ice sheets and mountains and experience how they impact wind movements and rain patterns over North America.

In this group project I was primarily responsible for design and programming the simulation that uses a Kinect sensor to detect depth and colour information of blocks on the tabletop that drive wind particle behaviour projected onto the tabletop. This prototype was created for NCAR as part of a class at ATLAS and a video can be seen here.

Twin Paradox Labs Identity

Generative Brand Design

The brand design for Twin Paradox Labs, a space startup redesigning the atomic clock which could revolutionise navigation on planet earth and in deep space. The generative brand mark visualises the fundemental physics of their cutting edge science with thousands of variations possible. The typography is a nod to the rich history of human space exploration. The brand tool to generate logos can be seen below.

Twin Paradox Labs Brand Generator

Generative Tool

The brand generator tool is web-based software which can be used by the Twin Paradox Labs team to generate brand logos as SVG or PNG for presentations, correspondence, product graphics. By altering parameters thousands of variations are possible to generate, allowing an customisable and playful visual take on the hard science of this project.

You can see the tool in action in this video here.

Data Walking Apps

Data Gathering Tool

Three web apps to help you gather geolocated data from your smartphone and download your collected data for you to analyse and use. There is the Count app for counting instances of things, such as counting types of vehicles you encounter on a walk. The Range app for tracking measurements, such as estimated height of trees you pass or perception of noise as you walk. The Words app for free entry of text, such as tracking your thoughts in locations or signage you see.

You can try the apps yourself here and start gathering geolocated data on whatever interests you

The apps are following an iterative design process to improve them and could spawn new variants. Recently the UX has been improved, a map that displays data points as they are added, and a GeoJson download option.

No data is stored on a server or database or seen by me, it is all generated and stored on the web app frontend page. You chose to download the data yourself.

Dancing Lines

Performance Capture

An ongoing collaboration with choreographer Rosella Emmanuele, to experiment with performance capture in dynamic public spaces with scalable performer numbers and unrestricted performances, where a traditional motion capture studio is not possible. We settled on using drones and handheld footage combined with Computer Vision and Machine Learning to capture the performers. At this stage there are three visualisations of the performances.

Write For Rights, Amnesty International

Generative Tool

For the Write For Rights campaign 2020, I was commissioned to work with the Amnesty International design team to create a tool and script that could generate portraits made from custom icons as key artwork for the campaign across web, social and print. The tool allowed the designers to select any image and icon, control grid size, icon size, icon thickness, add detail, change background colours, export to hi-resolution vector, generate a falling animation and alter the centre point of that falling animation.

You can see the tool in action in this video here.

youo can see more of the tool outputs on the Write For Rights website, and on their social media channels like Twitter and Instagram

Writes For Right, Amnesty International

AR Social Filter

Following the generative tool for the Write For Rights campaign 2020, we looked to create a digital interactive element and opted for a fun filter for social media using augmented reality.

you can see a video of the filter here, and try the filter yourself on Instagram

Data Walking Report

Print Publication

A 96 page report on the Data Walking research project, including writing on the aims and context of the project, some technical advice, exercises, workflows, workshops, and contributed visualisations of participants. While the report does not try to be a complete manual or textbook on data walking techniques, it does hope to pull together enough practical resources that it is functional guide to get anyone started doing their own walks.

Check the Data Walking website for more on this ongoing research project.

Future Medina Tate Exchange

Installation

An on site digital aggregator installation for the three day Future Medina event at the Tate Exchange space, Tate Modern, Switch House building.

To answer this brief we devised and developed a human/machine process/system. Students were tasked with documenting the activities in the Future Medina through a drawing, photography, writing, and audio recordings. These documents were displayed on noticeboards in the space, and posted to twitter which were pulled through to an animated realtime visualisation which aesthetically blurred the lines between the web, social platforms, and tools of creative practice. A large scale projection and interactive tablets filled the space with content generated from the activities, student documentation, and public reactions throughout the three days.

The Future Medina event culminated in a live audio-visual performance by Ravensbourne students.

Flux City

Kinetic Installation

A functional prototype of a research proposal by Desitecture. Flux City is a concept for a moveable facade to a building incorporating solar panels and hydroponic systems. Each facade unit can be moved position to enable more outer or inner space and optimise solar panel. Multiple units can be synchronised to transmit visible messages across the city.

Collaborating with Arron Wilson, we were tasked with building and programming an interactive and fully articulated scale model of multiple units for public display to stimulate conversation about the concept. The prototype involved 3D printing many custom designed components, and controlling an array of stepper and servo motors. Programmatically it is designed to be expanded to include more units, as well as hook up to local and networked data streams, or a human interface, to control the movements of individual units.

Flux City has been displayed at Smarter Cities conference, Vision London 2017, and NOW Gallery as part of London Festival of Architecture.

Data Walking Workshops

Workshop

Data Walking workshops have been held for six years and visited five different countries as parts of conferences, education programs at universities, and professional training. They have attracted a broad range of participants from all different backgrounds and skillsets. Workshops have lasted from a few hours to three days and cover technical skills to build sensors or accessible data gathering methods, through to data visualisation and interactive data maps.

Approximate

Reactive Sculpture

Throughout civilisation humans have made artistic and sculptural works to commemorate gods, leaders, loved ones; from giant heads carved in rock, through portraiture to selfies. Now, through the evolution and democratisation of technology, capturing and commemorating ourselves has never been easier.

Approximate merges the monumental statues of ancient civilisations with the selfies of today’s digital society in a compelling visual spectacle. A huge, translucent head, similar to the ancient artefacts found on Easter Island, interacts with audiences through cameras and facial recognition software. As the head recognises a face in front of it, it renders an approximation of it in a low resolution grid of lights. When no face is recognised, the head processes and renders in real-time historical climate data - a reflection on the potential cost to the environment as humans use nature’s resources to recreate impressions of themselves.

A documentation video of Approximate can be seen here: https://vimeo.com/dhunter/approximate

Approximate was commissioned by the Barbican and is on display in the foyer space until 16 October 2016.

Data Walking: Amsterdam

Research Project

The aim of this project is to collect environmental data while walking around a specific area to build a rich picture of that area over time. The focus of this phase of the research project was to explore using smartphones and photography to make maps. The result is a printed magazine detailing the process and iterative outcomes using those photos with computational design methods to create a map of Amsterdam. The image above shows one outcome in the process. The document is off to print shortly and I look forward to sharing the full contents when ready!

Check the Data Walking website for more on this ongoing research project.

Tate FUTURE

Live Visuals

Project lead alongside Francesco Tacchini and Jamiel Thompson, working with nine students from Ravensbourne, to develop a live visuals performance as part of the public opening of Tate Modern's Switch House. The visuals were projected onto the Turbine Hall back wall to accompany a DJ performance by Radar Radio. My role entailed project management and creative direction, as well as creating generative type animations and typographic compositions as source material for the student-led performance. A video edit of the performance can be seen here

Data Walking: Stratford to Barbican

Research Project

The aim of this project is to collect environmental data while walking around a specific area to build a rich picture of that area over time. Data gathering devices include sensors on micro controllers, smart phones, and recorded notes. This data is then used to create maps, charts, data experiences, or artistic works by participants to represent the area and the process of the project.

This is an ongoing research project in collaboration with Ravensbourne, a university sector college in North Greenwich, London, focused on the creative sector. Recently the Data Cylinders pictured were featured in the Barbican Centre, as part of the FIL Interfaces exhibition.

Check the Data Walking website for more on this ongoing research project.

Take Flight: Magicicada

Music Festival Installation

I was commissioned to create an installation for Lovebox and Citadel, summer music festivals in Victoria Park, London. Lovebox is now in it's 13th year and this became the focus of the research for the piece. Periodical Cicadas, are special species of cicada that emerge from the ground en-masse every 13 or 17 years, climb into the trees together, sing to attract mates and begin the lifecycle again. The similarities between a music festival and such a natural event inspired the wing designs, colours, structured gathering and placement amongst the trees of the installation.

Eat My Words

Data Visualisation Installation

A collaboration with Artist Annie Nichols. For years now Annie as a food stylist and artist has been interested in the performance of cooking in the kitchen. The repeat journey’s we make. The marks we make, and leave over time, because of them.

Most kitchen layouts are designed using a classic work triangle. It is a concept used to determine the most efficient use of space in a kitchen, usually between the cooker, fridge and the sink. But Annie is also interested in the different journeys we might make for creating, making and baking different recipes. What would the journeys look like if we could visualise them?

For the Fish Island Labs Interfaces exhibition Annie created Eat My Words. A light and sound installation based on the making of her Mum, Winnie’s, Victoria Sponge Cake recipe, of which she was famed. The sound artist Christin Rauter, recorded the sounds of making the cake in Annie's kitchen in Hackney Wick, and kitchen has been recreated as a light installation.

I worked with Annie to record the cake making journey and help create a digital visualisation of my cake. I produced a digital map of Annie making the cake, using my body movements within the spacem recorded using a Kinect. This created beautiful, frenzied images of the recipe making which make up the printed floor of the installation, visible above.

About Time

Data-Driven Clock

A collaboration with Annie Nichols. Annie is very interested in the idea of the sharing of space and time between different communities. Bringing an awareness of others, and a here and a there. Within her first year at Central Saint Martins, Annie won a competition (in conjunction with London Borough of Camden, The Holborn Hotel, C.S.M and Gloucester St Residents Association) to create a site specific public art work.

Working closely with local residents, she created ‘About Time’ a 3 screen video projection, which included a video clock using 24 hours of video footage filmed in resident’s homes and local businesses. One hour of footage was taken of each clock and edited together to create a working 24 hour clock.

Now, as a member of Fish Island Labs where she has been introduced to so many new and exciting technologies, Annie has been inspired to produce the clock again and bring it up-to-date, so she invited Me to collaborate and create a new clock for 2015.

About Time is a real-time data-driven clock pulling photographic information from around the vicinity of the Barbican and City of London, processing and re-rendering that data as time passes. In this way, About Time provides a colourful, visual log and representation of the activity, environment and the culture of the local area over the duration it is present.

DDA Award

3D Printed Award

An award I designed for the YouGov Data Design competition. This is an annual student contest, challenging students to develop designs using the YouGov profiling tool and their data.

The concept behind the award design was to combine bar charts and typography into a generative sculpture, utilising the newest software, technology and processes, which we felt communicated the approach and mission of YouGov and their Data Design competition. I created the award out of code in Processing and used SketchUp to check the generated form, then it was printed with a MakerBot 3D printer.

Take Flight

Interactive Sculpture

Take Flight is an interactive sculpture combining both fragility and vigour. Thirty-two sets of rhythmically beating wings mounted on a surface behave as a swarm, influenced both by one another and the curious visitors who may approach them. Take Flight is dynamic, occupying a space somewhere between the natural and the synthetic.

Each set of wings that make up the sculpture is unique, its design generated using a specific algorithm and the delicate filigree pattern giving each pair a distinctive character, creating an intriguing foil to their insistent movements.

Take Flight was commissioned for Level39, Canary Wharf. It has since been exhibited at NOW Gallery, North Greenwich, and Fish Island Labs, Hackney Wick.

You can view a video of Take Flight in action on vimeo: takeflight. If you are interested in including Take Flight in an exhibition, or further commissions, please get in touch using the details below.

A big thank you to Britta Pollmuller, Richard Colson, Keith Watson, Jeremy Gardiner, Jake Durrant, Jason Taylor, Stefan Christou, and especially Sam Greenfield.

Creative Coding Club

Education Programme

Creative Coding Club was an extra-curricular time and space at Ravensbourne to build a cross-course community for those who want to learn coding, improve their existing skills, or just to get to know others interested in coding. No experience was required, all were welcome. Creative Coding Club operated for two years until coding was more integrated into existing and new undergraduate courses.

Ravensbourne Sketchbooks

Print

Generative graphics for the covers of Ravensbourne Graphic Design course sketchbooks. The graphics were overprinted on discarded stock creating a huge range of varied cover design outcomes. By using discarded stock the project addresses issues of sustainability and reduces cost and waste.

Creative Coding 2013

Education Programme

Creative Code 2013 was a six week extra-curricular course to introduce programming to Graphic Design students at Ravensbourne College. Using Processing, the basics of programming were covered and then students were encouraged to explore further and tackle a brief or integrate creative coding into their own projects.

About

Multidisciplinary designer, coder, educator, and now PhD student at ATLAS, CU Boulder.

I have 15 years professional experience as a designer and educator. My research interests lie in creating tools and novel interfaces to information, now particularly Augmented Reality and Tangible Experiential. I initiated the Data Walking project which explores methods for geolocated data gathering and experimental visualisation.

As a professional I have been creating interactive experiences for screens and spaces, and using data-driven computational design processes. I enjoy working on projects from concept initiation, research, through to final outcome creation, for clients and in collaboration with others.

I was previously Course Leader of UX/UI Design undergraduate and a Senior Lecturer on the Graphic Design undergraduate programme at Ravensbourne.

Prior to working in education I worked for six years as a freelance digital designer and developer at a variety of agencies across London, and managing my own clients.

I studied Graphic Art & Design at Leeds Metropolitan University, gaining my Masters there in 2006. My work traversed investigating non-linear interactive video, application development, and print outcomes experimenting with format and organisation.

Contact

phone: +44 7869104906
email: mail@davidhunterdesign.com
twitter: @DHDPIC
instagram: @dhunterrr
vimeo: vimeo.com/dhunter